
The need to inspect traffic has been constant in the developer community over the years. Many tools have been built for that purpose, from Chrome DevTools available on Google Chrome or Microsoft Edge browsers to Postman with various instruments and ways to work with API endpoints. However, despite all the new software products that appear on the market and partially cover the needs of people working in the industry, Fiddler still stands out with a number of benefits over competitors; it has evolved a lot through the years and continues to be very popular.
In this article:
What is Fiddler?
Telerik Fiddler is an HTTP debugging proxy server application that captures HTTP and HTTPS traffic and displays it to the user. Fiddler can also be used to modify ("fiddle with") HTTP traffic for troubleshooting purposes as it is being sent or received.
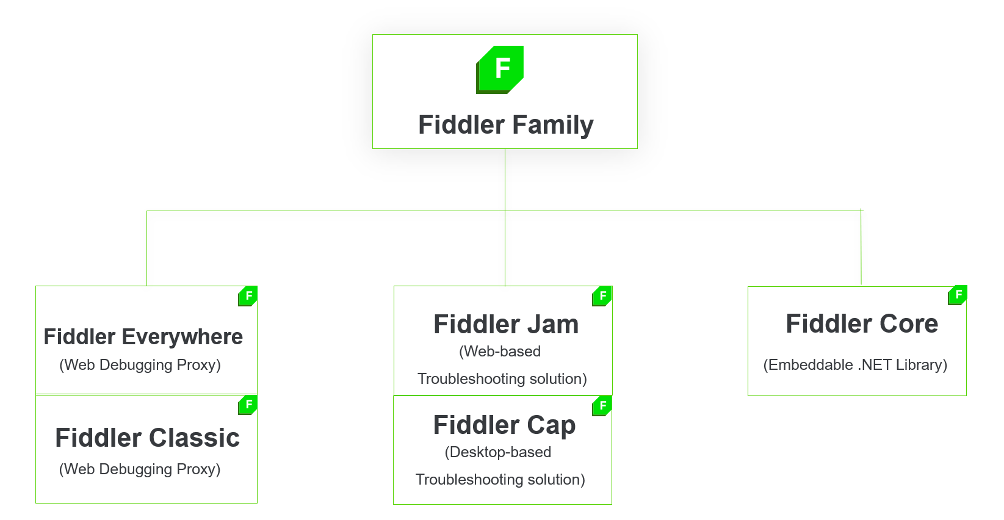
The Fiddler Ecosystem offers different products and tools to address specific use cases. Still, we will mainly focus on the original Fiddler Classic application, which is available for free downloading and provides the widest range of features.
Recently Telerik released Fiddler Everywhere – a new generation of Fiddler which runs on macOS, Windows, and Linux and has built-in team collaboration and an enhanced UI. It has a 30-day free trial and two pricing plans. However, its functionality is much more limited than in the Classic version.
Fiddler interface
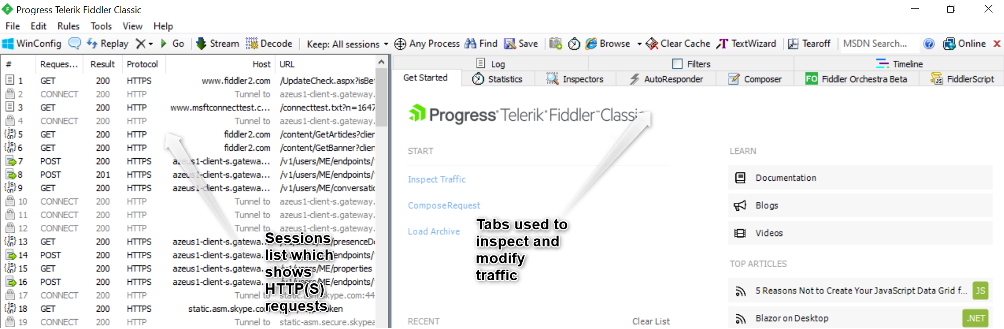
The Web Sessions list on the left contains the HTTP Requests sent by your computer. The columns can be added and removed, resized, and reordered. You can also sort this list by clicking on the column header.
There’s also a toolbar at the top of the screen and a number of tabs on the right, each serving a different purpose and providing different instruments for working with traffic. In detail, I will describe the most popular and useful for developers and quality engineers.
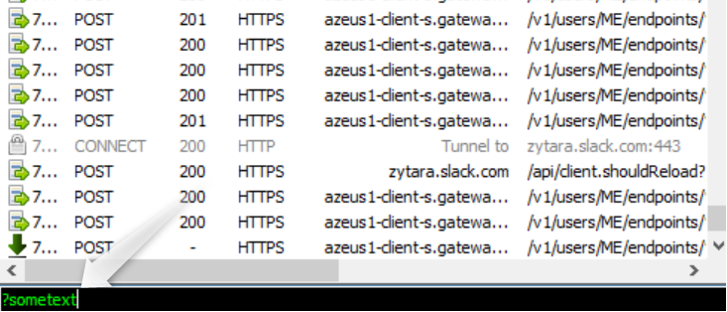
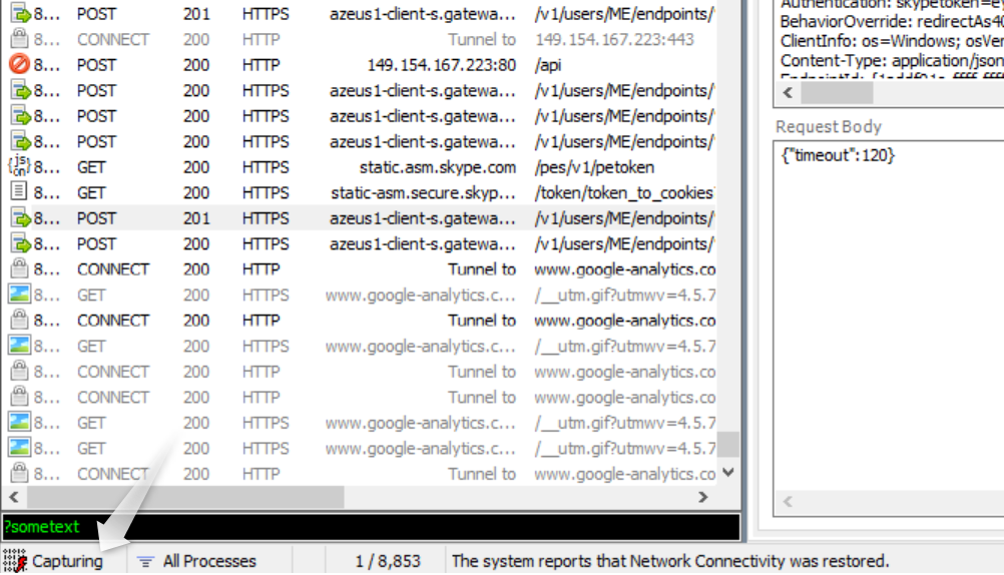
But before that, let's examine one more useful element of the Fiddler interface called Quickexec. This is the small textbox with black background under the sessions list where you can run some very useful commands.
You can type "help" + Enter to see all of them. I'll list a few most useful for testing:
- ?sometext - highlight sessions where the URL contains entered text (e.g., ?user);
- =status – find a session with specific response status (e.g., =502);
- =method - find a session with specific method (e.g,. =PUT).
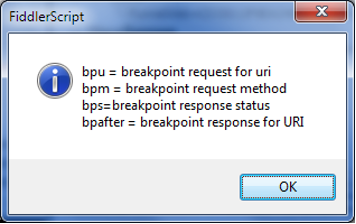
Quickexec also makes setting breakpoints fast and easy. Type in ''bp'' and enter – you'll see the dialog with breakpoint commands:
- bpu url – breakpoint on provided url;
- bpm method - breakpoint on a method;
- bps status – breakpoint on a status;
- bpafter url – breakpoint on a response from some url.
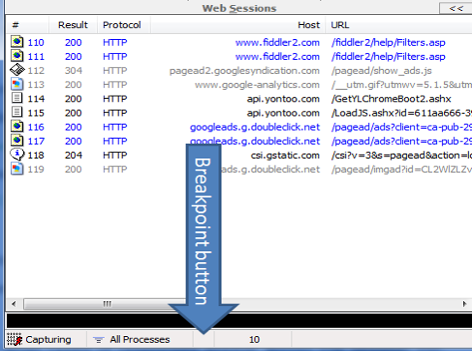
Additionally, breakpoints can be set using a small button on the status bar:
- click once – breakpoint on requests;
- click once more – breakpoint on responses;
- third click – remove breakpoints.
So, when we are already familiar with the Fiddler interface, let's go through the most useful and informative tabs located to the right of the sessions list.
Statistics tab
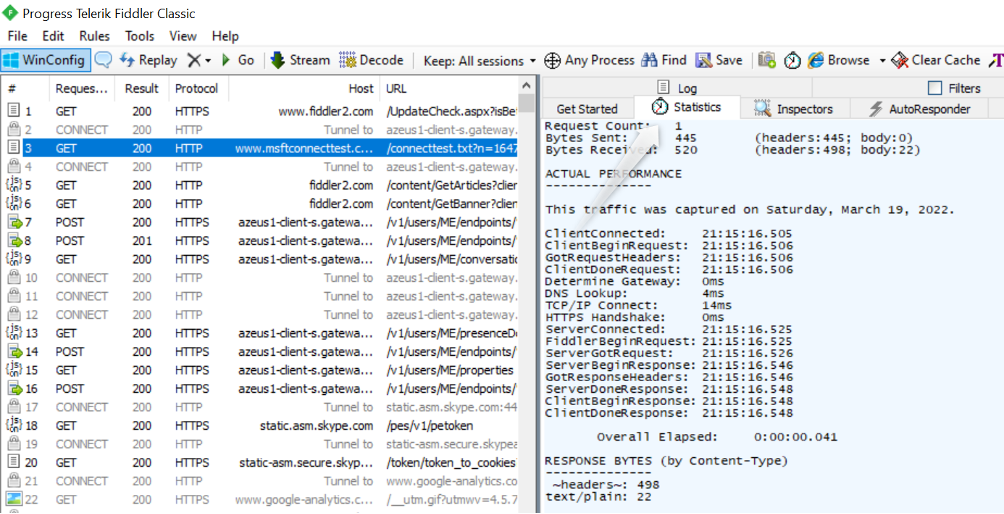
This tab allows us to see the performance statistics of a single web session or multiple sessions. The information listed in the tab includes different metrics; we can see how long the request took, how much data was transmitted etc. Different sets of data are provided for single and multiple selected sessions but in both cases quite useful for analysis.
Inspectors tab
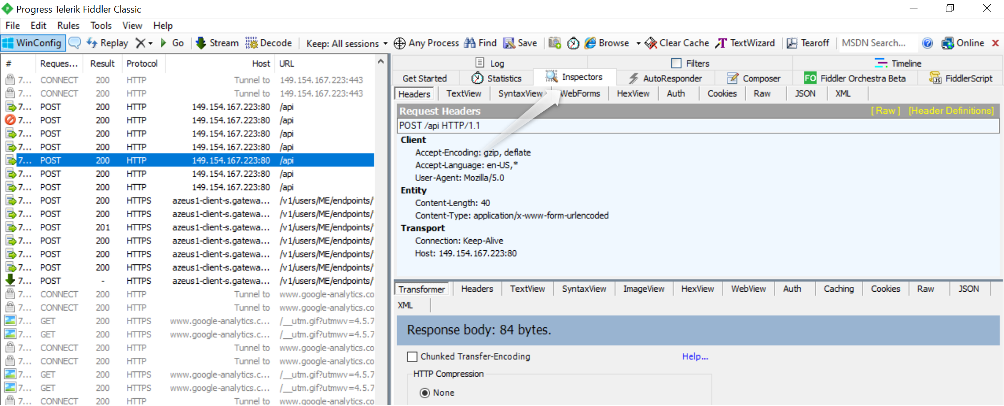
The inspectors' tab allows users to see detailed request and response information about selected HTTP(S) session(s). The top part of the tab contains data on what was sent to the server, and the bottom part is what was received from the server. Double-click any session to reach the tab immediately and switch between sections in each part of the tab to view the most relevant information in the most convenient way.
Autoresponder tab
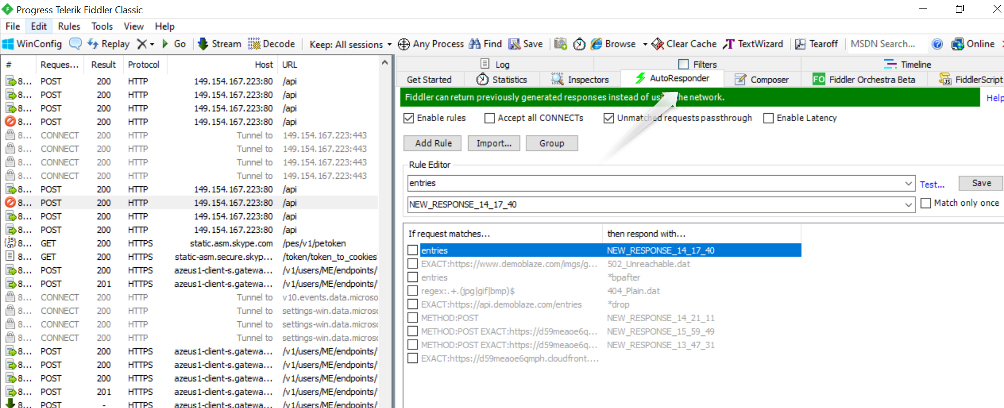
On this tab, you enter a match rule and an action string, and Fiddler Classic undertakes the action if the request URI and the match rule match.

By the way...
Apache Airflow Overview: Full Guide
Make your work simpler, automating most of everyday tasks. We're introducing a full overview of Apache Airflow, including Python tips.
Let's seeFor autoresponder to work, the ''Enable rules'' checkbox should be checked.
To create a rule, you need to select the URL from the sessions list and drag it into the AutoResponder tab or click on the ''Add Rule'' button to create a new rule. Also, rules can be created using the ''Import'' functionality based on previously captured traffic.
By default, Fiddler creates rules with an ''EXACT'' match (e.g., ''EXACT:URL'').
Users can enter any part of the request body, and all the requests that match it will be responded to with selected action (e.g,. ''METHOD=POST'' or ''info'').
''NOT'' match is applied only when the request doesn't match the one entered (e.g., ''NOT:URL'').
Fiddler Classic supports regular expressions syntax for expressions that begin with regex. The regular expression will be used to replace the inbound URL with the string in the Actions column. Use .+ to match a sequence of one or more characters, or .* to match zero or more characters. Use ^ at the front of your regex to mean "Start of the URL" and use $ at the tail of the regex to mean "End of the URL."
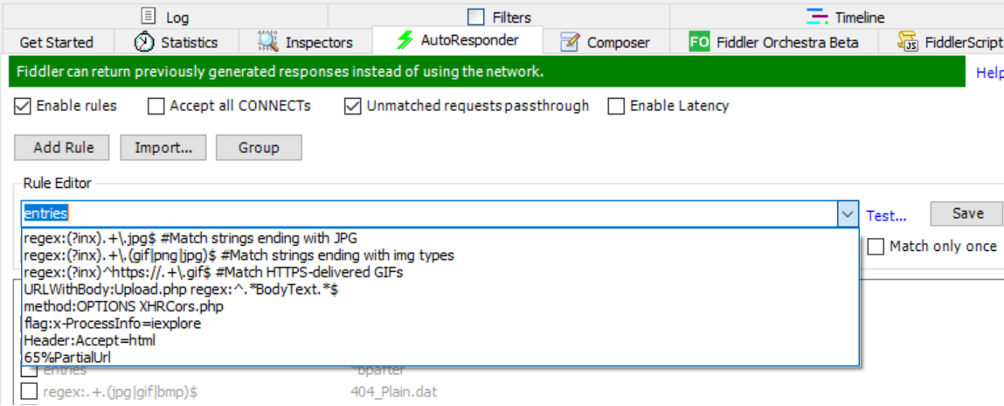
Ensure the ''Unmatched requests passthrough'' checkbox is checked if you want to create a rule that only affects certain URLs with some parameters, not all traffic.
The response can be selected from the list predefined by Fiddler. This list includes common error codes as well as some special actions. Some of the most useful ones are:
- *bpu - break on request before hitting server;
- *bpafter - send a request to the server and break on the response;
- *delay:#### - delay sending request to the server by #### of milliseconds;
- *drop - close the client connection immediately without sending a response;
- *exit - stop processing rules at this point.
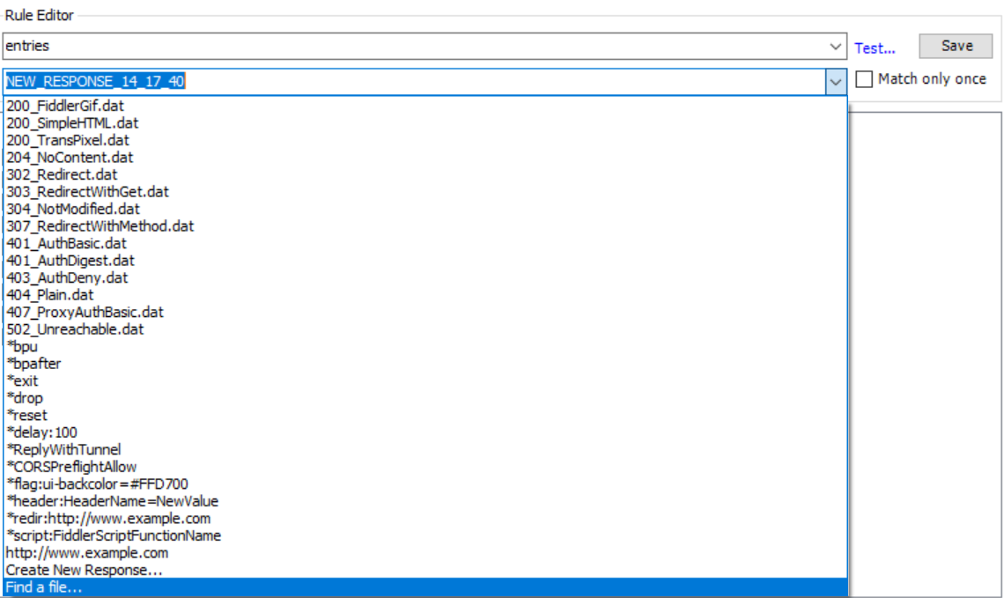
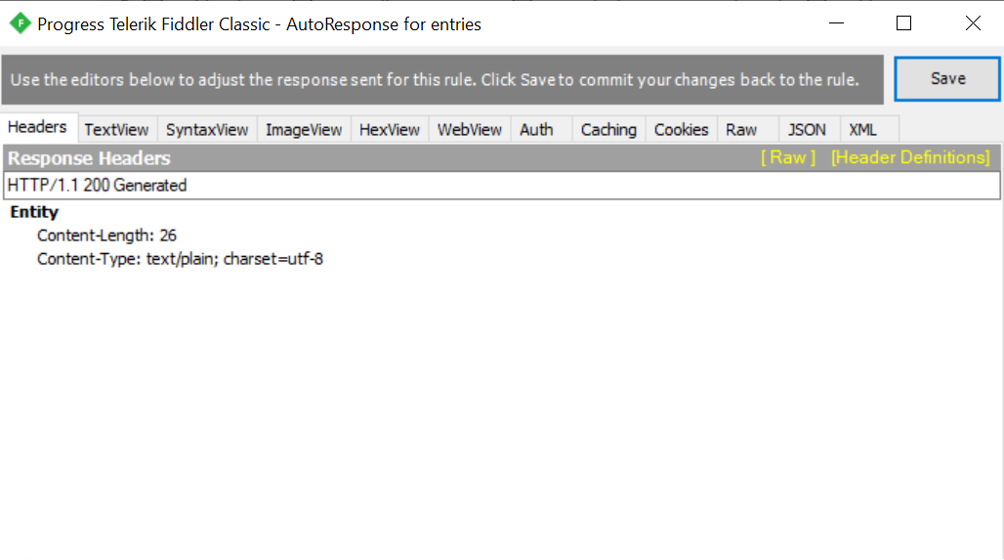
A custom response can be created by the option ''Create New Response…''. Custom responses can be saved to reuse later.
 Before a response is returned, you can optionally induce a delay (latency). To enable Latency, click the ''Enable Latency'' checkbox. Right-click one or more rules and choose Set Latency to set the desired number of milliseconds. If you wish to adjust the existing latency, simply type a plus or minus before the number of milliseconds. For instance, to reduce the latency for all selected sessions by five milliseconds, enter -5 in the prompt.
Filters
By default, filters are off, and all traffic that goes through your computer is shown in the sessions list. Finding needed requests can be quite difficult if traffic is heavy, so the ''Filters'' tab provides numerous options to filter and flag only needed ones and perform some lightweight modifications.
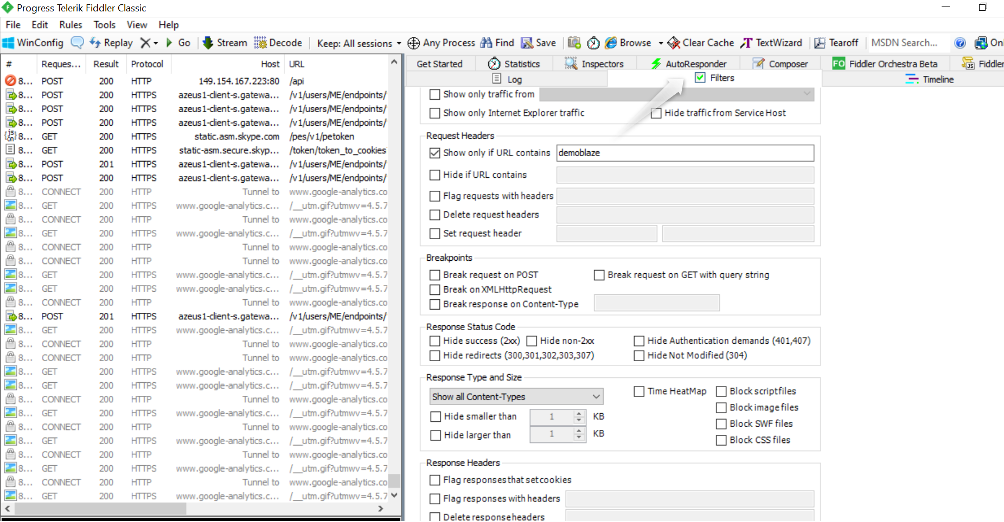
Filters tab allows to limit sessions amount using the following options:
- ''Hosts'' where you can select ''Zone'' filter (traffic from Intranet (e.g., dotless hostnames) or Internet (e.g., dotted hostnames)) and ''Host'' filter (show or hide traffic from specific hostnames). Wildcards can be used in the Hosts text box, and you can specify as many hosts as you want, divided by semicolons.
- ''Client Process'' where only traffic from a certain process or application can be filtered.
- ''Request Headers'' where you can add or remove HTTP request headers and flag responses that contain certain headers. Also, you can filter displayed traffic down to specific URLs using the ''Show only if url contains'' text box. Regular expressions can be used in this filter’s text box.
- ''Response Status Code,'' ''Response Type and Size,'' and ''Response Headers'' allow filtering and flag sessions based on response data.
Also, the ''Filters'' tab allows you to set breakpoints. There are four options that enable you to break requests or responses that contain the specified attributes.
However, filtering can be done not only using the ''Filters'' tab. Fiddler provides several more options to limit sessions shown to users. One of them is ''Process Filter'' in the toolbar.
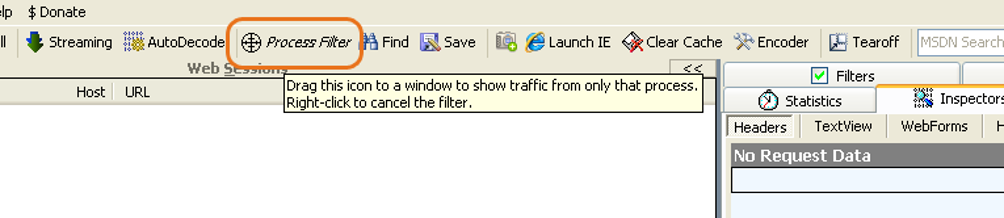
To use this functionality, press the left mouse button and drag it to the window of the particular process. When that window is highlighted, release the mouse button. After that, traffic in Fiddler will be limited to that process only.
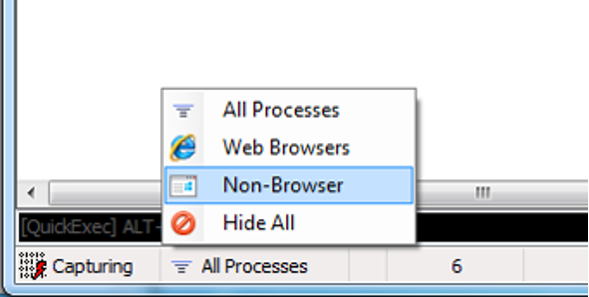
There's also a very quick and easy way to filter sessions by process category using a button on the status bar. By default, it’s set to ''All Processes,'' but you can change it to one of the selections:
- ''All Processes'' (by default)
- ''Web Browsers''
- ''Non-Browser''
- ''Hide All''
Composer tab
You can create new requests from scratch by specifying method, URL, and request headers, edit an existing captured request, and send and test them using the ''Composer'' tab.
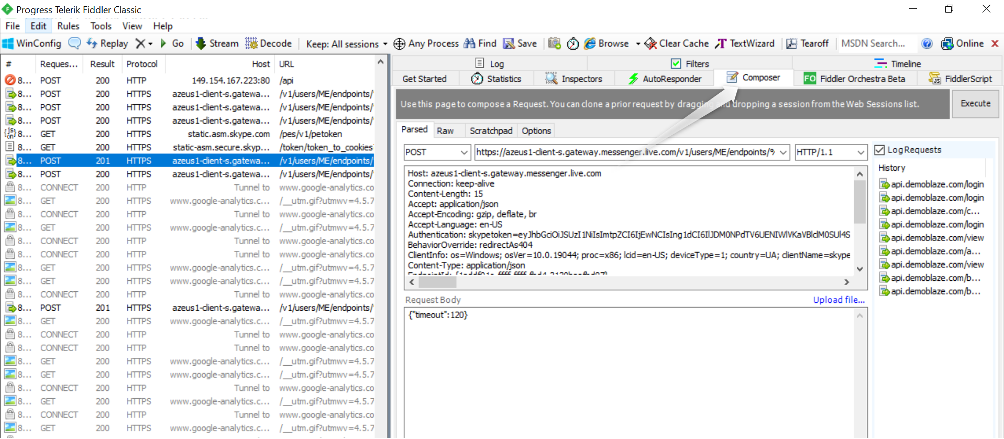
In the composer tab, you can select the HTTP method of your request, enter the endpoint URL, provide headers of the request and its body and execute it. You can also see the history of requests that were previously created and executed from this tab, select any of them, and modify and execute them.
A helpful feature is to reuse already captured sessions by dragging them to this tab. All the information from the session will be auto-inserted. You need to execute to reissue it or modify it and execute it anew.
In addition to already examined tabs that allow users to inspect, analyze, modify and create web traffic, there are several others, but in my and my teammates' experience, they were used less frequently, so I won't go into details on them.
One more important function is that Fiddler can simultaneously capture traffic from multiple remote computers and devices (like Android and iOS smartphones) and with certain configurations (in Fiddler checking ''Allow remote computers to connect'' in Settings > Connections, installing Fiddler certificates on devices and adding Fiddler Host and Port to Manual Proxy configuration of your Wi-Fi connection) you can see traffic from your phone in Fiddler sessions list.

One more thing
Git Branching Model: Git Flow
In this article we will tell you how to organize development team work on the project using Git.
Tell me moreTips and tricks
Some valuable tips and tricks come in handy when you work with Fiddler:
- There's a ''Capturing'' button in the bottom left of the screen. By default, it's off, and no traffic appears in the sessions list. You can click ''Capturing'' to capture traffic and click it again to stop.
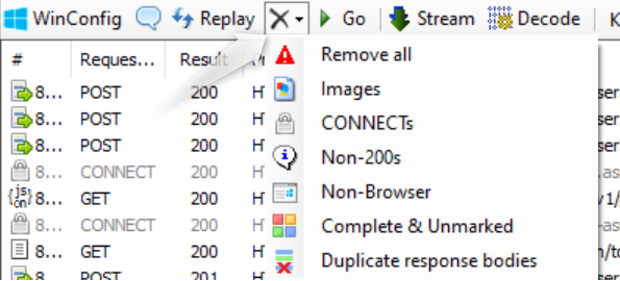
- To clear sessions, there's a special button on the toolbar. Also, all traffic can be removed using the ''Edit'' menu button (Edit -> Remove -> All Sessions). And there's a Ctrl+X shortcut that clears sessions.
There are other useful shortcuts for user's convenience in working with Fiddler:
- CTRL+A - Select all sessions;
- CTRL+H - View Header Inspector;
- CTRL+T - View TextView Inspector;
- Alt+Q - Activate the QuickExec command line;
- CTRL+F - Find sessions.
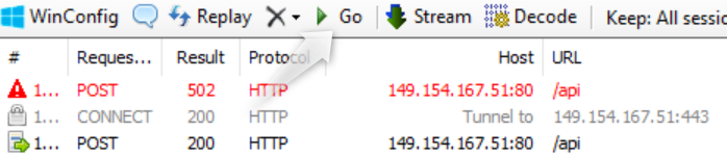
- There's a ''Go'' button on the toolbar, which can be used to proceed with requests that were stopped because of a breakpoint.
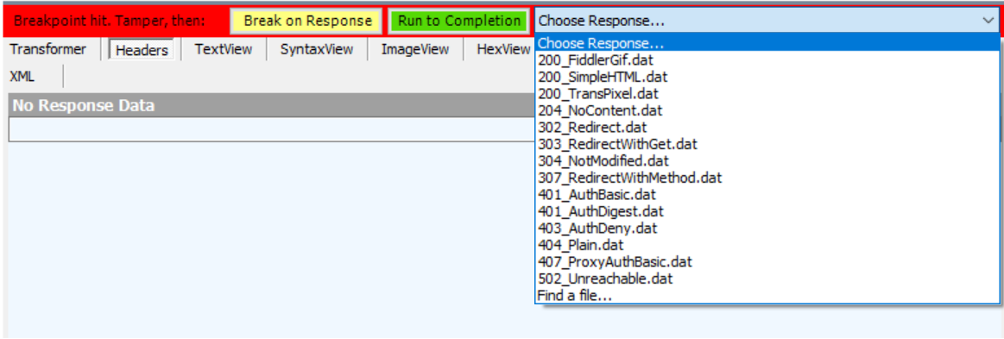
- ''Run to completion'' on the ''Inspectors'' tab can also be used to complete requests as well as return some common error codes on response.
- Press the R button when any request is selected to reissue it.
- Use ''File > Save > All Sessions...'' to save all the captured traffic to *.SAZ file or select any amount of requests by Ctrl+Click and select ''File > Save > Selected Sessions...'' to save only this part of the sessions. Sessions attached to bug reports can make understanding the root cause of the issue and reproducing it faster and easier.
Conclusion
Fiddler has been trusted and loved by many software engineers over the years. This application provides developers and testers with a wide range of features that make testing and debugging faster, easier, and more convenient. Also, Fiddler is evolving through the years; new functionality has been added, new versions released, new users are discovering Fiddler, and despite many competitors, Fiddler continues to be one of the most used proxy applications on the market.
If everything described in the article sounds exciting, install Fiddler and try it yourself.