
The performance of mission-critical enterprise applications has a direct impact on customer satisfaction, employee productivity, business agility, and profitability.
To date, applications written in React are gaining more and more popularity. Developers love building all kinds of React apps because of their ability to handle UI components in browsers. On the other hand, it can cost you dearly. The size of a React application can be quite large for most React applications, which affects performance. The reason for this is that React is an advanced library and does not improve the performance of a website or application on its own. It must be properly configured and optimized in various aspects. Also, if you plan to attract a lot of users to your site, you need to optimize performance in a high-traffic environment to avoid unnecessary hassles.
For these reasons, knowing how to use best practices and optimize web applications is essential for both the developer and the product manager. This understanding is useful for ensuring that your React application provides a consistent and better user experience. In this blog, you will find how to speed your react application up and use performance optimization techniques, especially in high traffic scenarios.
In This Article:
What is Web Application Performance?
Web application performance is the ability of a software product to depend as little as possible on hardware resources: processor time, space occupied in internal and external memory, the bandwidth of communication channels.
In the professional developer community, there are two typical models of performance opinions:
Some developers are obsessed with performance issues, which causes them to put a lot of effort into supposed optimizations.
There is a general tendency to underestimate performance issues stemming from the justified beliefs that exist in the industry: "do it right before you do it fast" and "next year's computer model will still be 50% faster."
Where is the truth? Developers are often clearly over-concerned with micro-optimization. As already noted, performance is worthless if the program is incorrect. React performance concerns must be weighed against other goals, such as extensibility and reusability because optimization can make software so specialized that it is not reusable even when the specification changes.
When Performance Issues Occur?
You can develop web applications for years and experience little to no application performance issues.
But, most likely, problems arise in the following situations:
Big data appears (you need to render large lists or hundreds of thousands of points on the map).
The application becomes large (hundreds of user scripts, dozens of screens, forms, and so on).
A large number of clients from different regions (for example, 300,000+ clients per day from all over the world).
High competition in the market (for sure, the user will prefer your competitor's application if it works faster).
A mobile version is required (so far, browsers on mobile devices suffer from performance issues).
Application Performance Analysis Methods
An APA (Application Performance Analysis) specialist analyzes network traffic to identify the causes of performance issues. The network is a universal environment that combines various architectural app components of applications. In the vast majority of cases, the analysis of network transactions provides the necessary and sufficient information to find a failed element. However, this method has its limitations. For example, we can see that this server introduces the greatest delay in the execution of the user's operation. We can even highlight the most problematic call, for example, a GET or POST request, when loading a web page and its corresponding long SQL query to the database. But what happens inside the server at this time remains behind the scenes. Moreover, if, for some reason, the database server was combined with the application server within the same host, then it is almost impossible to separate their influence on the total execution time of the operation by this method. Fortunately, in most cases, the application of this method brings good results. From my experience, I can say that about 99% of calls to me are resolved successfully. In this case, the information received by the APA service is key.
Many software and hardware tools are on the market today to help manage application performance. We use two main tools, one to examine pre-recorded transactions in detail and the other to continuously monitor application performance by decoding and analyzing their network traffic.
Now let's take a closer look at the methods for implementing individual areas of APA.
Operational Support Methods
A key condition for success in operational support of application performance is a clear formalization of each incident. The user, as a rule, describes the problem subjectively and often very emotionally. At the first stage, it is vital to separate the emotional component (too strong coffee, bad mood or dislike for any application) from the direct definition of the problem. It is important to note that APA does not involve direct work with users, all the necessary answers are received by universal specialists of the first and second levels of support. Sometimes some of the necessary information can be obtained using React automatic application performance monitoring tools.
Further, the command responsible for this application provides a fairly complete description of its architecture (which host is responsible for what and what network transactions are expected between them during the execution of problematic operations). Sometimes incomplete information is given, which is not an insurmountable obstacle to the investigation. Also, you can ask them to install the necessary agents on the client and server parts of the application. Agents are used to collecting statistical information from network interfaces. They are installed in strict accordance with the instructions, and in 99% of cases, their installation does not cause any difficulties.
Then, you can agree on a procedure for directly testing problematic operations: either reproduce the problem yourself according to the instructions, or you can ask the user to do it on your command. At the same time, you need to activate the recording process on your agents. The resulting material is a set of trace files simultaneously recorded during the execution of a problematic operation at several observation points. They contain a complete history of network activity on selected hosts. The key advantage of the tool I use for analysis is the ability to combine these files into one time-aligned file (that is, 0 seconds of the trace file taken from the client exactly corresponds to 0 seconds on the server trace files). This will give you the opportunity to track the entire course of the operation in time - how long the client request went over the network to the application server, how much it spent processing before sending the necessary request to the database, how long the database processed this request, and so on.
Initial performance and architecture analysis of new applications
This type of activity is entirely based on the methods used in operational support. In addition to them, we also have the ability to mathematically predict how the user interface performance will be in different regions for centralized applications.

On the topic
How To Set Up A Scalable React Architecture: Tips And Best Practices To Follow
Scalability is a must in the modern world. Build the best scalable architecture using React and our tips
Let's seeApplication performance monitoring
As mentioned above, it can be tough to get an objective assessment of the application's performance from the user. Simply due to the subjectivity of the question itself. On the other hand, technical support in their work cannot operate with subjective metrics. This contradiction often leads us to try to fix non-existent or non-essential breakdowns while the really important problems are left unattended. The main conclusion is that in order to manage the performance of applications installed in the enterprise effectively, you need to have an independent system of automatic performance monitoring. Relying on users in this matter is pointless.
To resolve this issue, we use tools for continuous monitoring of application performance by decoding and analyzing their network traffic. Here, the source of information is the SPAN ports configured on the switches of interest to us. That is, we practically do not interfere in the work of the systems of interest to us. No agents are needed on the servers. The received information is collected and filtered on special probe servers and transmitted to the central server. This server is responsible for analyzing and storing the received data, providing a reporting interface, and automatically alerting you to application performance problems.
This solution helps to find out about existing problems quickly, and often gives a hint where to look for the root cause of their occurrence. Not as detailed and accurate as it can be done by means of operational support, but still enough to significantly speed up the investigation process. In addition, we can see long-term trends in application performance, as well as evaluate the effect of infrastructure changes.
Progressive Web Metrics
Progressive Web Metrics (PWM) — metrics to help identify performance issues. Despite the existence of load and DOMContentLoaded, PWMs give developers a lot more information about how a page loads. Let's walk through PWM and try to understand the meaning of each metric.
First Paint (FP)
Devtools gives us a metric like FP, time to render. In other words, this is the time at which the user will see a blank page.
The FP event is fired when only one graphics layer has been rendered, no text, images, canvas or anything like that. However, FP provides some information potentially useful to developers.
Because it's not a standard metric, it gets a little tricky to measure. There are different measurement techniques, for example:
using requestAnimationFrame,
CSS load tracking,
even using DOMContentLoaded and load events (their problems are described above).
But despite the best efforts, FP is of low value because text and images can be rendered somewhat later depending on the weight of the page and the size of the resources and scripts being loaded. This metric is not specific to PWM, but it will help us understand how the rest of the metrics work.
To understand how content is actually displayed, we need another metric.
First Contentful Paint (FCP)
This is the time it takes for the user to see some content, something other than just a blank page. It can be anything — text, SVG, or even canvas. As a result, the user understands whether the page loads at all after entering the URL and pressing Enter.
FCP is called at the moment of rendering the text (and the text that is waiting for the font to load is not taken into account here), an image, or some other content. The time between FP and FCP varies from milliseconds to seconds. The difference is clearly visible in the screenshots above. That's why a metric showing the actual rendering of the page is important to us. See also the FCP specification.
What is the use of the FCP metric for developers? If the time to FCP is too long, there are two reasons:
poor network performance,
large resources that take a long time to load.
First Meaningful Paint (FMP)
First Meaningful Paint is the time it takes the user to see the main content on the screen. Is it helpful for us?
What is the main content? This is when shown:
- title and text for the blog,
- search phrase for a search engine,
- images if they are critical to the web application.
But this does not include:
- spinners or other loading animation,
- FOUC,
- the navigation bar or page title.
FMP is the rendering that follows the largest change in page structure. Due to Chromium's implementation, this metric is captured by the LayoutAnalyzer, which collects all layout changes and measures the time of the most significant change. This time it is FMP.
What is the benefit of FMP for developers?
If the main content is not shown for too long, it means that too many resources (images, styles, fonts, scripts) have a high priority and eventually block FMP.
Visually Ready
This is when the page looks ready, but the browser hasn't finished executing all the scripts yet.
Estimated Input Latency
This is a metric designed to determine how adequately the application responds to user actions. Getting back to the Estimated Input Latency metric: the user expects the page to respond to their actions instantly, but the user will be disturbed if the main thread is overloaded with long tasks.
First Interactive
The event fires when the application is ready to interact with the user. This is a combination of three events: FMP, DOMContentLoaded, and visually ready page at 85%
The First Interactive metric is split into two metrics Time to First Interactive (TTFI) and Time to First Consistently Interactive (TTCI). The reasons for the division are:
Defining a minimum threshold for when the UI responds well, but it's okay if it doesn't.
Determining the state when the application is fully ready to interact, according to the RAIL guidelines.
Visually Complete / Speed Index
Visually Complete is calculated by taking screenshots of the page and comparing them using the Speed Index algorithm. Sometimes this is not easy at all: if the page has changing images, such as a carousel, it will be difficult to get an accurate result of the Visually Complete metric.
The Speed Index itself calculates the median between Visually Complete results. The lower the value, the better. 100% result Visually Complete is the final point when the user faces the last question: does he like what he sees?
Find Performance Bottlenecks
As any networking professional knows, users often complain about slow network performance when it's often not the network that's slow, but the applications. However, the cause of poor application performance is difficult to determine, as it can be caused by anything from poorly written code to overloaded servers or bandwidth. A lot of time and money is spent on searches: employees cannot work effectively, business processes stall, users are annoyed, which negatively affects even customers. As soon as application performance issues arise that lead to user frustration and even reduced business productivity, networking professionals must follow these guidelines quickly and efficiently. The sooner the root cause of a problem is identified, the sooner it can be corrected, with minimal business impact.
When it comes to troubleshooting application performance issues, there are two ways to make diagnosing easier, faster, and more accurate: first, you should understand the common causes of application performance issues, and second, you should use suitable tools.
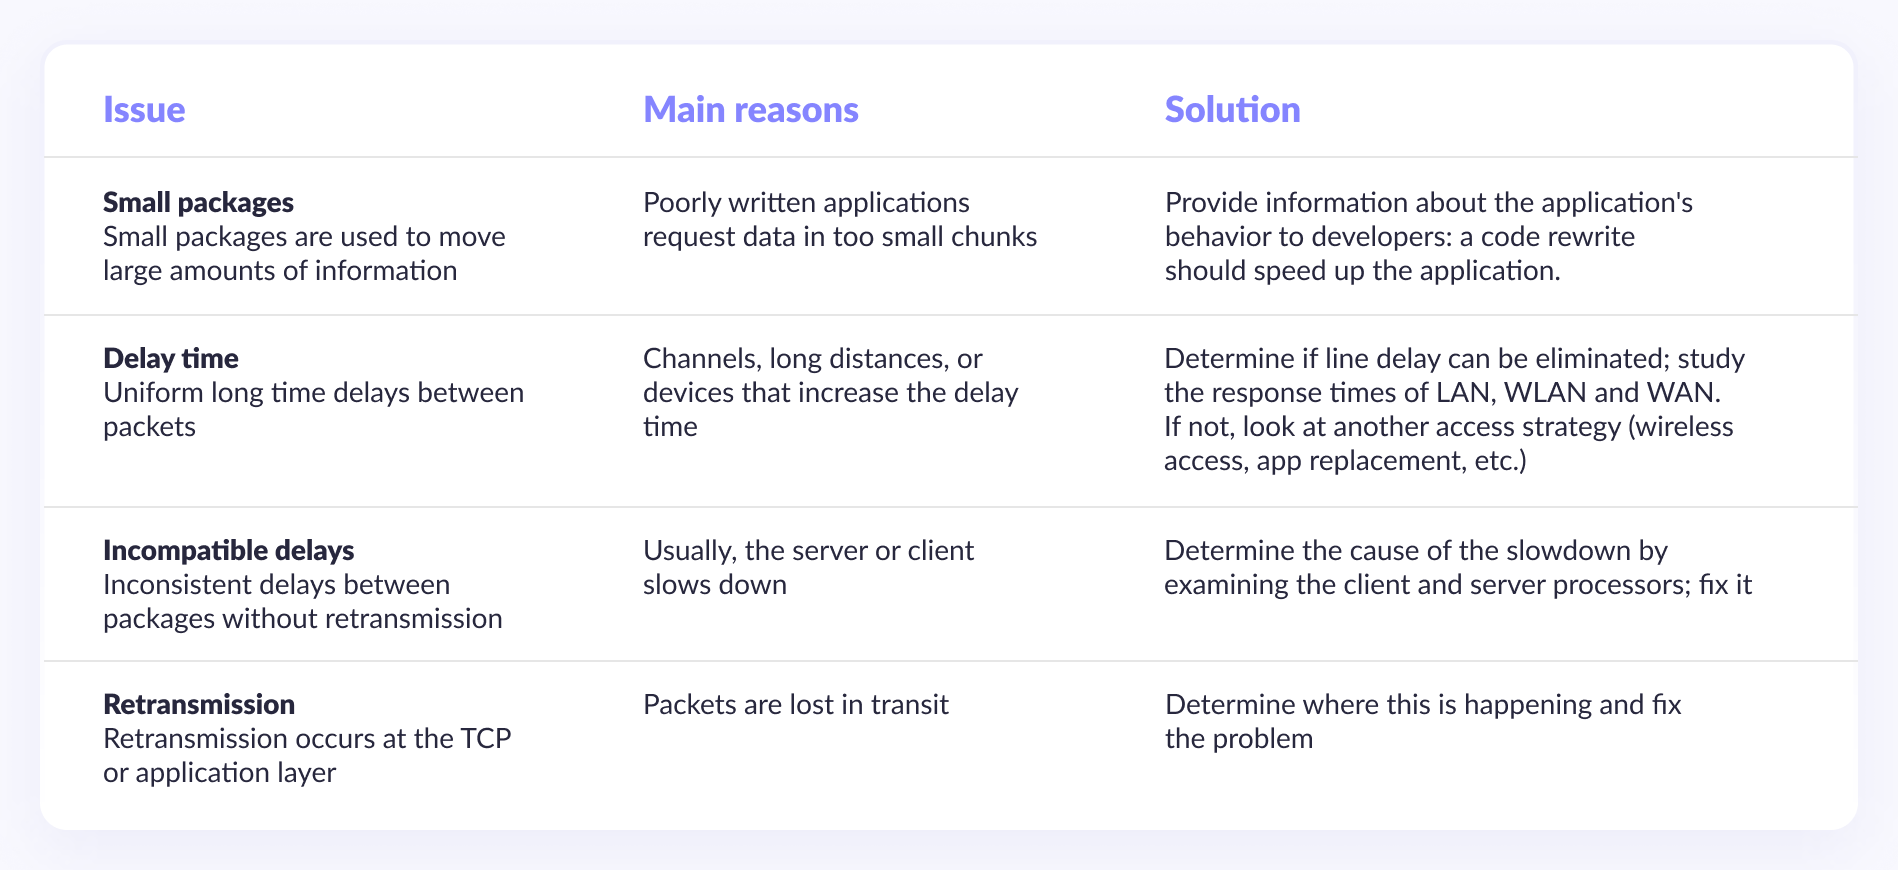
Understanding Common Causes of Application Issues
When a user says that the network speed is slow, the network professional must determine if the network is really bad or if it's probably poor application performance. To determine the cause of the slowdown, the networking professional must first understand the four main causes of application performance problems and how to solve them.
Using the best diagnostic tool
The second step in isolating problems is choosing the right tool: portable, versatile, and compatible with existing network components, providing an overview of the entire network. There are many tools available, from fixed hardware and software for troubleshooting problems at the corporate level to free or low-budget software that can even be run on a laptop. Among the problems with these tools is the hardware, which is fixed and not portable. Most likely, the problem will arise where you do not have a detector. Portability is essential because it's important to get to the location of the problem. The root of the problem may lie anywhere in the network infrastructure, so you must have access to all parts of the network to resolve the problem effectively.
In addition, no alternative tools allow diagnosing all problems at once, so several are required, each for its purposes:
- SNMP polling tool,
- wiring speed detection tool, hardware package,
- Protocol Analyzer,
- traffic monitoring tool,
- utility (telnet) host management tool.
This means that network engineers must learn to use and interpret a variety of tools. Then long and hard to combine all the information from these tools into a general view of your network. The use of multiple tools also generates costs for user training, instrument maintenance, and software upgrades.
Consider the following scenarios to fully understand the benefits of a portable, integrated analysis tool for diagnosing the root causes of slowdowns,. In each case, a handheld integrated network analyzer was first used to determine the likelihood that the slowdown was caused by network problems and then to determine the real cause of application problems.
React App Performance Tips
React.PureComponents
For components using primitive data, you can use the React.PureComponents base class, which internally uses the implementation of the shouldComponentUpdate() function to reduce rendering time. This small but clever practice can greatly improve parent component load times.
Immutable Data Structures
Avoid directly modifying objects by making copies of the objects with the desired data changes. Use immutable data structures that will automatically apply this process when the object's state changes. This will make it easy to detect state changes, which improves your React app's overall performance.
Production assembly
To give code warnings and other useful information about the code, React has host environment checks scattered throughout the files. While this helps developers, there is no point in going through this when deploying an application to production. To remove these unnecessary lines of code, do a production build with npm run build as best practice and improve the performance of your React app.
Compression
To load the client-side JavaScript load faster, compress the JavaScript code using Gzip or Brotli on the application server. This will allow faster fetching and serving, resulting in faster component loading and rendering times.
React Developer Tools
It is available as an extension for Chrome, Firefox and will help you identify unnecessary renders of your react components by highlighting them with different colors. You can install it and open it while working on react app. In the "Highlight Updates" field, you should see the react components marked green, blue, yellow, or red. With red being the highest frequent updater, these colors indicate the possibility of unwanted and frequent rendering. This way, you can click on any element/component and check if it needs optimization based on the indicative color for the render loop.
Chrome DevTools
Google offers Chrome Dev Tools , which run in your chrome browser to edit and render changes to your web pages easily. These tools help you analyze performance issues in your react app without having to create a build. Using Chrome DevTools, you can see loading components and their loading times to identify potential bottlenecks and unnecessary visualization for code optimization.
3 Steps to Improve the Web App's Performance
In fact, the difference between running on a local host and a real production server can be so dramatic that if you don't take a few precautions, you'll realize as soon as you release your application that most users experience your product extremely poorly, and they probably hate you for it.
To help prevent this, we've created a set of recommendations with the most effective steps you can take to improve the performance of your web application in the first place. Also, these steps will help you prevent performance degradation when new features appear after a great first release.
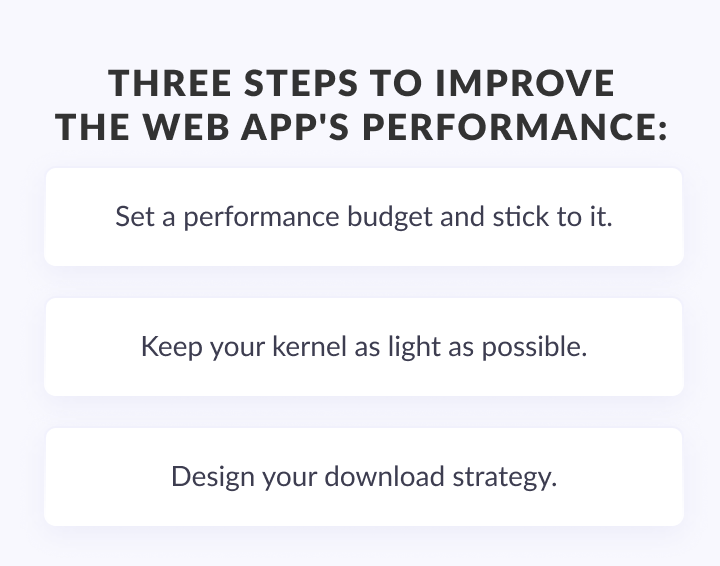
1. Set a performance budget and stick to it.
The performance budget is a clear target that expresses how fast your application needs to be. The goal is to prevent your team from turning the product into a mess of packed features that takes forever to load, which is pretty much inevitable on long-term projects. As you can imagine, there are two main components to this strategy: set a performance budget on your own, and stick to it as you work (this is where everyone falls short).
The best way to implement this is to allow the product owner to clearly prioritize performance. This is to force the team (designers and developers) to focus on the mobile version, for which speed is one of the most important features.
When this is done, the next step is to insert a rule into your CI Pipeline that will block all requests to commit changes that do not meet all the requirements. And no, you can't make exceptions (that's the point of the CI rule).
2. Keep your kernel as light as possible.
The core frameworks and libraries you choose to build your product usually stay with you forever, making these decisions fairly irreversible.
So if you've chosen an incredibly large industrial framework that somehow needs to run a Linux virtual machine in a browser, you can say goodbye to your product's performance until the next big refactoring. Which, of course, never will, because removing things is much, much, much more expensive than adding them.
The best advice I can give you is to choose the easiest possible solution that will help you get the job done. Suppose you're building a product that's very close to what a browser can do on its own (like a news site, blog, e-commerce, or anything that mostly shows the text, images, and video). In that case, you usually need the bare minimum to help you build an organized code base and try to keep order when accepting pull requests.
This is where your professional eye is needed. If you're building a product for millions of mobile users, choosing a terribly heavy industrial stack can be disastrous in terms of both UX and revenue. If, instead, you're working on some in-house application that a few people use once a year (or if you just want to try out a new framework), you can throw in whatever you want because no one will care.
3. Design your download strategy
If you've been in this space for a while, you know that over time you'll have to cram an incredibly heavy component into your product, destroying all the performance gains that were in the first release. And worse, it will demotivate your team, as they will feel that all their efforts to make the product fast were pointless.
But don't despair! When that happens, there is an opportunity to cheat, and it's called Boot Strategy Design, which splits the effort between designers and developers.
The main principle behind a good Download Strategy is never to let users know when an application is downloading. And if it can't be avoided (for example, during the initial download), make the process as fast and pleasant as possible by downloading the important things first and everything else later or never.
The best way to experience this is to pick the heaviest component in your app (you know, the one that requires a ton of JS, even though it's only used twice for the whole site) and break the loading process into two sub-components:
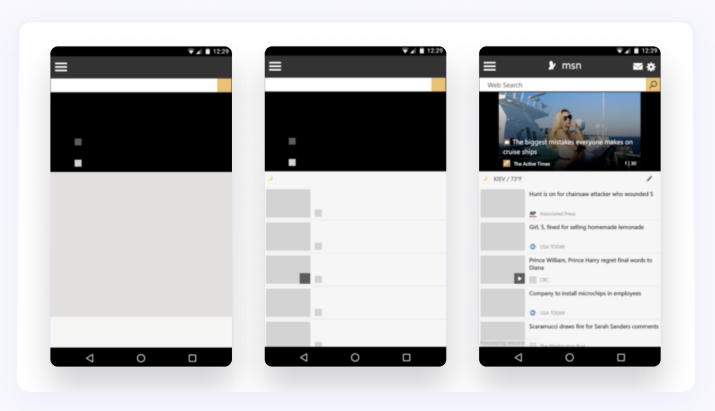
A "placeholder" version of a component that requires the most minimal amount of code but fits perfectly on the page and looks just like something real. For example, if the component is a complex video player that loads dozens of add-ons, you usually only need to show a thumbnail and a play button. This is exactly what you will show the user when the web application first loads. You will get additional benefits if they look like they really work.
The real version of the component, which you will download as soon as everything important on the site is properly loaded. The best way to do this is to defer the loading of this component's dependencies and everything else until the window load event. When you finally have all this code, you can openly replace the "placeholder" subcomponent with a real, working one.

By the way...
Fundamental React Concepts And Its Personality
We've been talking about React all this time and didn't even mention best practices! Check them out now
Sounds interestingConclusion
Modern applications make extensive use of JavaScript and rely on browsers to provide a real-time and smooth browsing experience. React is one of the most popular JavaScript frameworks for building faster apps with great designs. However, React applications can quickly grow large, causing performance issues and crashes. Also, just like any other application, high traffic can significantly affect the user experience. By using coding and deployment best practices and tools, you can optimize your code to improve the performance of your React application.
If you are looking for a partner to develop and optimize React web applications — fill out the contact form, and our manager will contact you to discuss all the details.